
Fractal Image Explorer
Although not related to my Bronze Art, one of the curiosities that I have developed is my artistic Fractal Image Explorer program. This is used to create wonderful images of mathematical fractal functions.
Fractals are functions such that whenever you look deeper into a section of the curve you see repetitions and self-similarities to what you first started with. Fractals are recursive and iterative and chaotic.
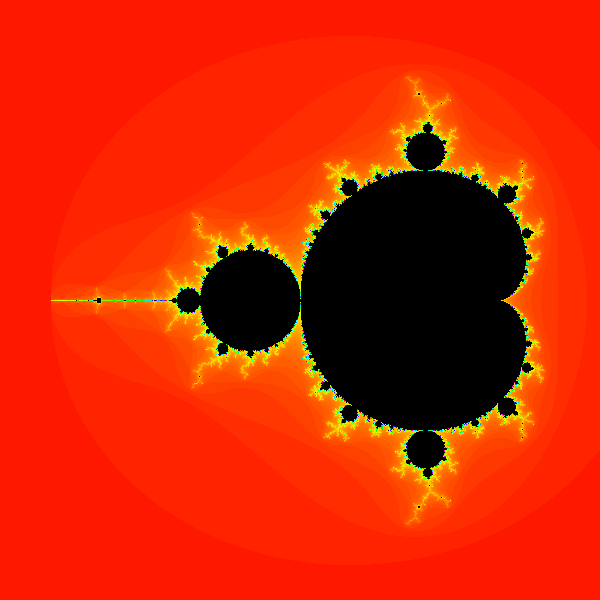
Benoit Mandelbrot was a mathematician who in 1979 discovered the Mandelbrot set of points. Images of the Mandelbrot set display an elaborate boundary that show ever-finer recursive detail at increasing magnifications. This set has a boundary that is a two dimensional fractal shape. Mandelbrot gave us a simple iterative way to calculate the points. The set is calculated as:
Each point in the set is a complex number ![]() A complex number is a number that has both a real part and an imaginary part. It is put in the form a + bi, where a is the real part and bi is the imaginary part. Complex numbers extend the idea of real numbers into the complex plane. The real part is the horizontal axis and the imaginary part is the vertical axis. A complex number a + bi can be represented as the point (a,b) in the plane.. We can make an image of the Mandelbrot set by thinking of pixels on our computer screen as points in the complex plane. To generate a Mandelbrot image we evaluate each point or pixel by iterating for a maximum number of times. Each time we iterate we test the point to see if it is in the Mandelbrot set. A point is inside the set if its distance from the origin is less than 2. If it falls out of the set or escapes from the set then it is given a color that relates to the number of iterations it took to escape. Otherwise, If the point is still in the set at the maximum number of iterations then it is usually colored black.
A complex number is a number that has both a real part and an imaginary part. It is put in the form a + bi, where a is the real part and bi is the imaginary part. Complex numbers extend the idea of real numbers into the complex plane. The real part is the horizontal axis and the imaginary part is the vertical axis. A complex number a + bi can be represented as the point (a,b) in the plane.. We can make an image of the Mandelbrot set by thinking of pixels on our computer screen as points in the complex plane. To generate a Mandelbrot image we evaluate each point or pixel by iterating for a maximum number of times. Each time we iterate we test the point to see if it is in the Mandelbrot set. A point is inside the set if its distance from the origin is less than 2. If it falls out of the set or escapes from the set then it is given a color that relates to the number of iterations it took to escape. Otherwise, If the point is still in the set at the maximum number of iterations then it is usually colored black.
Mandelbrot Set
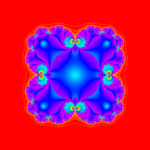
The Julia set is related to the Mandelbrot set. It uses the same formula as above, but rather than always starting Z from zero as c ranges over the plane, we fix some c and let the initial Z range over the plane. Julia sets are centrally symmetric.
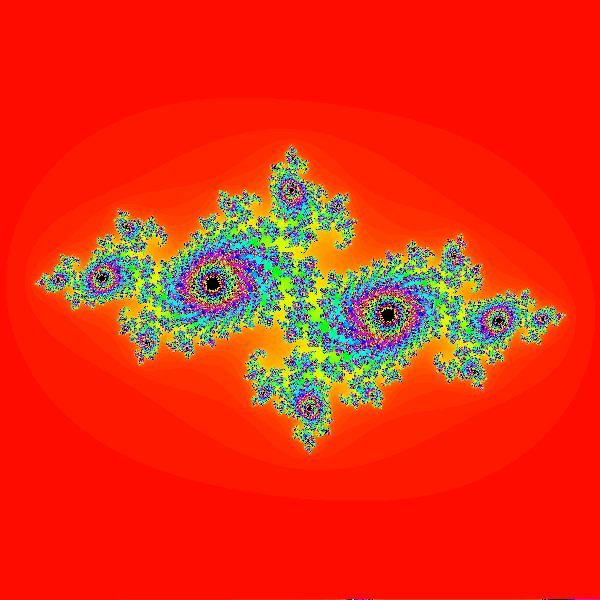
julia set (0-72689533,0-18888713)
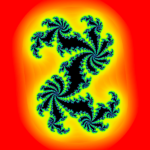
A very nice Julia set that looks a bit like a dragon can be seen at c = -0.2 – 0.7i.
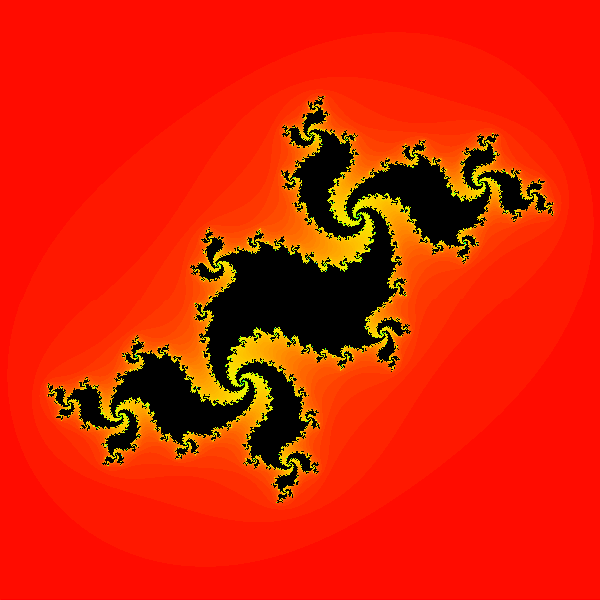
julia_-0-2_-0-7
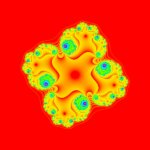
Another Julia set that looks like a fractal rabbit (Douady’s rabbit) is at c = -0.12 + 0.75i.
Douady’s Rabbit
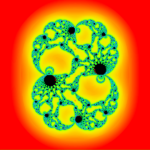
A Julia set with some wonderful colors can be found at c = -0.75 + 0.015i.
julia_-0-75_0-015
Fractal Image Explorer v1.1
I have developed a Java application to generate and display these fractal images based on earlier work by Evgeny Demidov[2]. My Java application shown below can show the Julia sets at various places on the complex plane. This application will automatically traverse the boundary of the Mandelbrot set. Click anywhere in the Julia set to stop the animation. When stopped, click on any point in the Mandelbrot set to see the related Julia set. A left click or middle click will zoom in to either the Mandelbrot set or the Julia set to see fractal repetition. A right click zooms out. Using the shift key changes the drill down from a linear zoom to a faster quadratic zoom. The Mandelbrot and Julia set images can each be saved as PNG images.
You can securely run this application in your web browser if you have Java installed on your system and your security settings allow for self signed applications. Alternatively, you can download and install this application as a stand-alone program if desired.
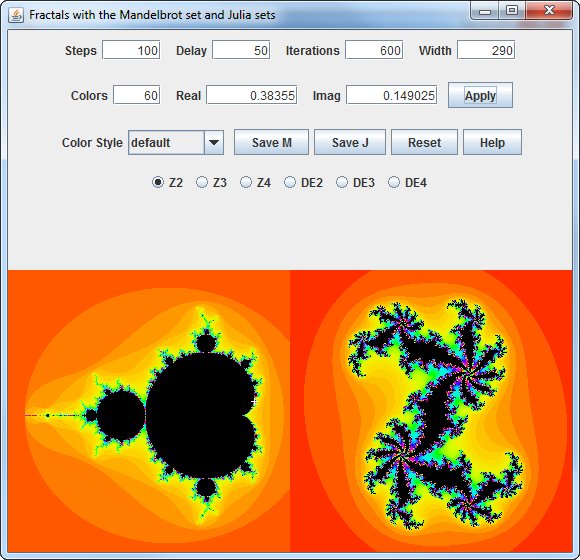
The default colors of the Mandelbrot set and Julia sets shows how quickly points in the complex plane escaped from the set. Red colors represent points that escaped quickly and blue or violet colors represent points that took many iterations before the value became too large. The default colors are known as the Rainbow coloring scheme.
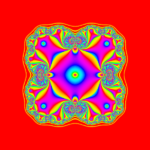
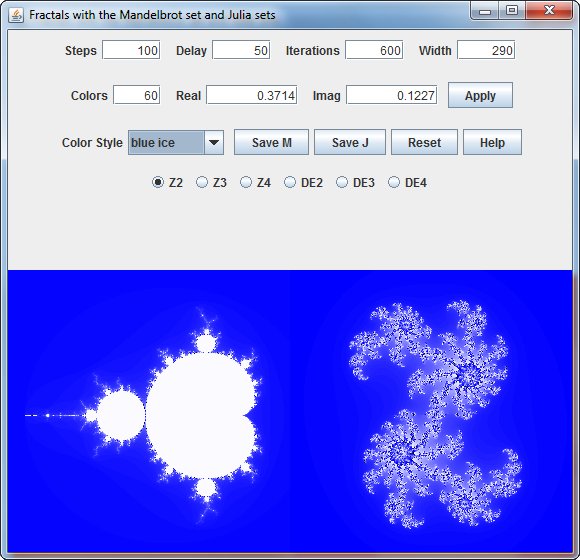
However, coloring is subjective. Other color styles can be applied to the escaping iteration counts to produce many different images. The example below shows a blue and white coloring scheme. The fractal images now look more like snowflakes.
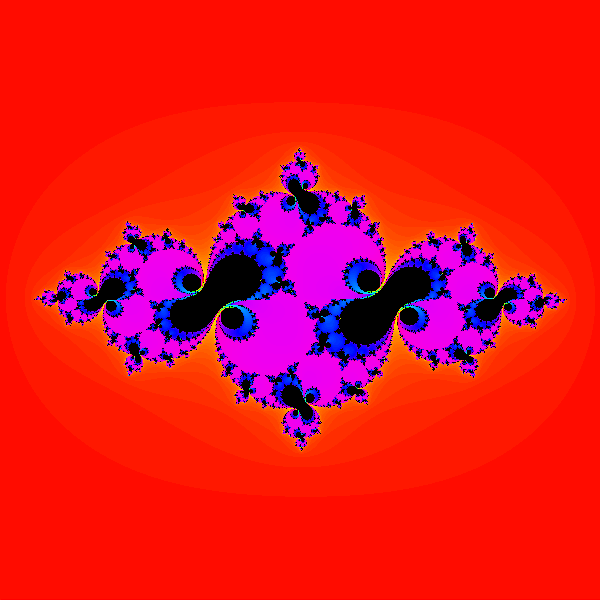
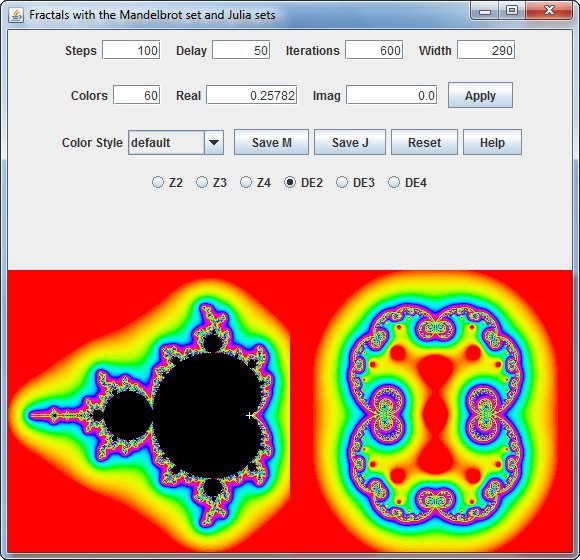
Using standard iteration counts for colors produces discrete values that can result in color bands in the image. The boundaries between the colors can be smoothed by using different algorithms that frequently generate continuous color values[4]. One common method is to measure the distance of the point from the origin when it escapes from the set. I have used a distance estimating method in the image shown below.
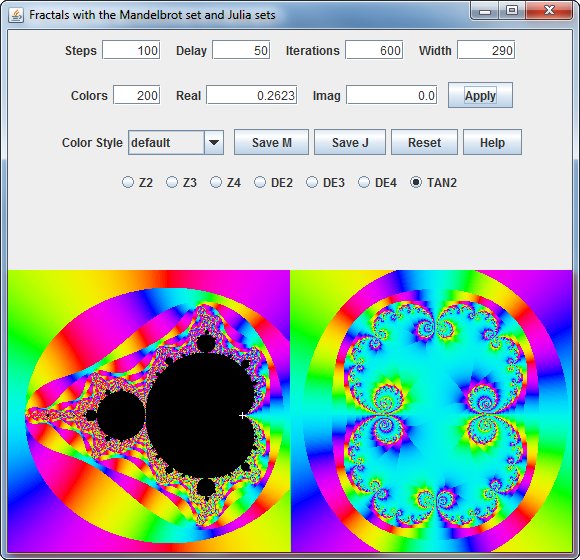
Other methods measure the angle of escape or the velocity of escape. For example, the polar coordinate angle can be computed as follows:
This will yield a value in the range 0-N. The number N determines how many segments the circle of possible angle values is divided into, i.e. if N is 2, the image will be colored according to whether the imaginary part of Zn is positive or negative. With a nicely shaded colormap, a larger N up to 250 gives beautiful pictures.
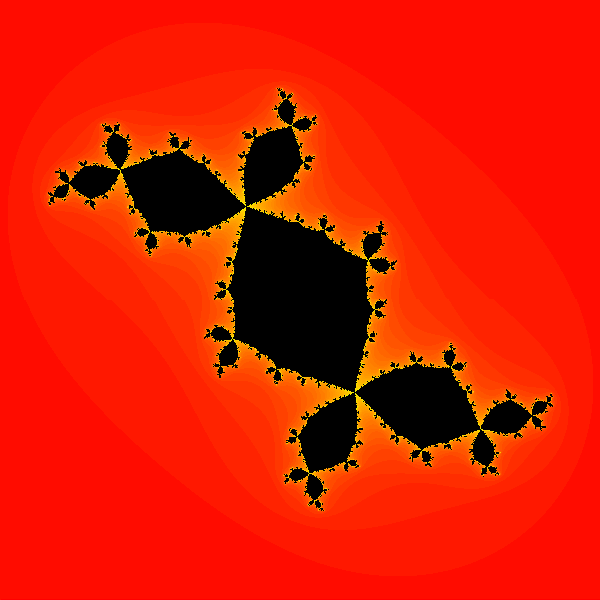
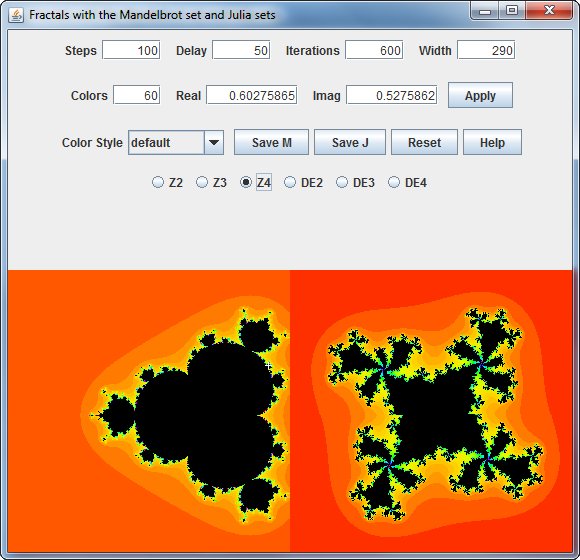
It should be noted that the Mandelbrot equation Zn+1 = Zn2 + c is not the only equation that can be used to generate fractals. The example below shows the Mandelbrot set for the equation Zn+1 = Zn4 + c.
Boundary Tracing Algorithm
One difficulty when displaying fractals is the computation time necessary for the number of pixels that need to be calculated. The fast performance of this solution is primarily due to the Boundary Tracing algorithm by Michael Ganss[3].
The fact that the Mandelbrot set is connected implies that there won’t be areas of one color “inside” areas of a different color. This means, that if you trace the boundary of a region of a single color, i.e. determine the connected set of pixels of one color whose members have at least one neighboring pixel of a different color, all the pixels inside that area will have that one color also. Color in this context refers to the iteration value of a single pixel. The algorithm is this:We scan the whole screen pixel by pixel, keeping an offscreen map of iteration values for each pixel (initially set to all -1s to signal “not done”). If we hit a pixel not done, we start tracing its border going right and keeping the “wall” to our left until we get back to the starting point. For each pixel, the next pixel visited will be computed thus:
check pixel to left (looking in the current direction, i.e. if the current direction is right, the pixel to the left is the one above it). If it’s part of the wall (i.e. offscreen or a different color than the one we’re tracking), go to 2. If it’s not, it is the next pixel.
do same for pixel straight ahead. Go there if it’s not part of the wall.
ditto for pixel to the right. If this pixel is also part of the wall, go back one pixel.
When we’re back at the starting point we trace the boundary once more. Now, whenever we move up, we plot pixels to the right of the current one until we hit the wall.
The complexity of the Boundary Tracing algorithm is in O(n2).
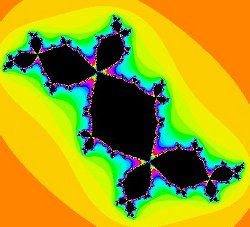
In the left image below only 13% of pixels are calculated and all the rest are simply flooded. But it is evident that you can get wrong picture (to the right) for very large scale. This can be corrected by zooming into the image by clicking on it. Try it now.
Download and Installation
For Microsoft Windows systems, if you would prefer to install this program locally on your computer, download and run Fractals 1.1-1.0.exe. This is an installer for a fully bundled (43 MB) implementation with a self-contained Java system.
For Linux systems you can install the fully bundled (58 MB) RPM package fractals-1.1-1.0-1.x86_64.rpm. After downloading, to install the package use:
rpm –ivh fractals-1.1-1.0-1.x86_64.rpm
To install the application for local execution on a system with Java already installed, download and unpack the (3.1 MB) Fractals 1.1.zip file. Inside the unpacked folder in this zip file you will find the fractals.jar file and a library directory for the help system. This is the Java application. If the .jar extension is configured in your system as a Java application then you can run the program by directly clicking on this file.
To run the project from the command line, go to the application folder and type the following:
java -jar "fractals.jar"
References
2. Evgeny Demidov http://www.ipmras.ru/~Demidov/Mset.zip
3. Michael Ganss http://www.ibiblio.org/e-notes/MSet/TheAlmondBreadHomepage.htm
4. Francisco Garcia, Angel Fernandez, Javier Barrallo, Luis Martin Coloring Dynamical Systems in the Complex Plane
5. David Leberknight https://www.leberknight.com/fractal.html


Howdy mate, I just found your website. As the original author of this code, I’m sure you’ll be interested to know that I just ported it to JavaScript. The link on your website is now broken too, no longer hosted at softwarefederation dot com. Here’s the new link… I’m sure that with this it will be easy for you to port your version to JavaScript too. Cheers, David Leberknight https://www.leberknight.com/fractal.html
Thanks for the update, David.